Smatterings Logo

Some useful smatterings of information, and some more substantial ones too, to help make your working life easier.

Contents

Visualise Your Data & Turn it into Information

Top Tip

Accounts Guardian

Who Am I?

Team Quiz Answers

Birth Announcement

Time-Savers

Did You Know…?

Smatterings Offer

Gamble-Free Guarantee

Please feel free to pass on any useful information you find here to people you know. Just enter your name, your email address and the email address of the person you want to send the link to, click Pass It On and we'll send them a link for you.

Your name:
Your email address:
Friend's email address:

We will only use your friend's email address to send Smatterings to them. We will not pass any personal information on to third parties.


Visualise Your Data & Turn it into Information

Spirit Level


Lists


Access       Excel
Word       PowerPoint


Reports


Bar Chart


Pie Chart

Human beings are incredibly good at spotting visual patterns. The picture that's hung slightly crooked or the label on the CD that's not quite centred; these things irritate us because we notice them so easily. We take in a huge amount of visual data and analyse it all day every day without even noticing. So why not use these skills to get a better feel for your business?

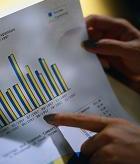
A visual representation of your data - a graph or a chart - can often give you a much better idea of what's happening than a list of figures or dates. You can get an immediate impression of the situation, and if you then want to look at the fine detail you still have the data available.

You also have the graphs instantly available whenever you're putting together a report or presentation, giving you a quick and clear way to present your information.

There are several ways to produce a visual representation of your data, using both Microsoft Access and Microsoft Excel. And it doesn't matter where your data is held. These same tools can be used with many sources of data including Access, Excel, Sage, text files, csv files. For example, both Access and Excel can be used to analyse sales or costs in Sage Line 100 or market research data provided by a third party.

Access has the facility to draw simple, straightforward charts. These can be shown on reports, but perhaps more usefully they can also appear on your main screens. For example, we have a client who deals with rolls of film. They take a series of 20 measurements of the thickness of a piece of film at different points along its length, and these measurements are stored in the database. Below the boxes where the measurements are entered, they are plotted on a chart, which allows the user immediately to get a feel for the variance in the measurements.

The big advantage of using Access charts in this way is that the data that is plotted is always for the record you are viewing, so as you change records the chart is shown on the same screen and is automatically updated for you.

When you need a more complex graph or you want a professional-looking report or presentation, you need to move on to Excel. Wherever your data is stored, Excel is a powerful plotting tool. You can plot multiple sets of data on the same graph. You can have two sets of axes on a single graph to allow you to overlay data in different ranges. You can add trendlines and error bars to your charts. You can produce 'stacked' charts so you can see the breakdown of the whole into its component parts directly on the graph. Visually, you can choose the colours, sizes and styles of plotted points and lines, make a 3D chart with some data in front and some behind, show and format text, and so on.

And these features apply across a range of different graphical options. From bar charts to pie charts, line graphs to scattergrams, there are a whole range of analytical and pictorial options available to produce a completely customised view of your data.

A client of ours has graphs set up to analyse their sales data over the last year. These include a bar per week to show sales made, a line to show the target sales they wanted to achieve and another to show the minimum acceptable sales, and a number in each bar to show how it compares with the same data for the previous year.

Excel can also be used to produce interactive graphs. One of our clients collects a lot of data via web pages that we set up for them. The data can be broken down into different locations. In Excel they have a series of graphs for various performance measures. They can view the graphs for each location by choosing the desired location from a dropdown box; as they do so, the graphs automatically update to show them the data for the chosen location.

Finally, Excel can also be used to produce time management charts (often called Gantt charts) using some macros and the data from your project. You can get an instant overview of when jobs are scheduled to take place or how your staff are spending their time.

Visual representation can be added to an existing Access database or Excel spreadsheet, or incorporated into a new system. It can also be applied to data from other sources, for example you can analyse accounts data held in Sage or consumer data provided by a third party, using all the same tools.

And don't forget, once you have your charts and graphs you can easily add them to Word documents and PowerPoint presentations, or indeed anywhere else you want them to appear.

Could you benefit from adding charts or graphs to your system, or creating a graphical report for some data? Check out this issue's offer for a great deal!


Top Tip

The Microsoft Office suite - including Word, Excel and Access - is extremely powerful. Almost any task can be automated, just as long as it follows set rules and doesn't need to be thought about by a person. If you can think of it, we can program it!


Accounts Guardian

Do you want greater control of your accounts? Do you want quick access to information about what you're buying, selling and spending? Then check out Accounts Guardian, our free simple accounts software.

Have all the financial information you need about your business available at the click of a button!


Who Am I?

Something a little different for this issue's quiz. Here's a description of one of us, but is it Philippa, James, Katherine or Robin?

I was born in West Yorkshire, but moved to Cambridgeshire when I was 3. My father is a mechanical engineer and my mother was, for many years, a physics teacher. Following in their footsteps, I had an aptitude for maths and science at school. After Sixth Form I went to the University of Birmingham to study maths and physics. Having graduated, I returned for a year to study materials science. I then moved, with my partner, to Manchester to work for a company making scientific instruments. The following year we got married. A while later we moved to Somerset for my spouse's job, and after spending some time unemployed I eventually started my career at Software-Matters. I initially worked three days a week, but my hours have changed several times over the years. We moved out of Somerset some time ago, again for my spouse's job, to a location that allows me to continue with Software-Matters. Who am I?


Team Quiz Answers

Here are the answers to our last quick quiz about the Software-Matters team. Whilst we all work in almost all areas of the business, we are each primarily responsible for…
Philippa
Philippa
James
James
Katherine
Katherine
Robin
Robin

… producing specs
… working out prices

… designing the website
… working with geographical systems

… building Excel projects
… writing Smatterings

… testing
… sending out invoices


Birth Announcement

Dummy

Daisy
James and his wife Amy are delighted to announce the birth of their daughter, Daisy May, on 13th May 2011. Naturally this is an exciting time for them and their two-year-old son Jacob, and we wish them all well.
Baby's bottle

Time-Savers

Clock

Welcome to a brand new regular section, Time-Savers. Here we'll give you handy little hints and tips that could save you time and frustration whenever you use your computer!

To get us started, here are some keyboard shortcuts that will save you having to constantly switch between using your keyboard and using your mouse, or stop you needing to get through a series of menus.

  • Undo: Press Ctrl+Z to undo your last action. This works in most programs as it's become an industry standard. Pressing Ctrl+Z a number of times will usually undo a series of actions, if the program you're using allows this.
  • Open a drop-down list: Press F4 when your cursor is in a dropdown to open up the list - exactly as if you had clicked on the drop-down arrow. You can then choose the option you want by using the arrow keys to select it. Again this works in most programs.
  • Switch between lower and upper case letters: In Microsoft Word, select the text you want to change and press Shift+F3. This will change the text from lower case to title case to upper case in a cycle; just keep pressing Shift+F3 until you get to what you want. (Title case is where the first letter of each word is capitalised and the remaining letters are lower case.) This is much quicker than navigating through Word's menus to get to the same result.

Did you know...

… Software-Matters is on Twitter! Follow us for regular really useful tips that will save you time. Just click the button below to see our tweets!

Follow SoftwareMatters on Twitter


Offer

It's time your data worked with your natural abilities! Visual representation - charts and graphs - are quicker and easier to interpret than long lists of data, so why plough through lists of figures when you can get all the information you need at a glance?!

Do you want to add some charts to your Access or Excel project?  Call us on 01747 822616 by 30th September 2011 to discuss the best way to proceed and we will give you 10% off when we build your charts and graphs. Just quote Smatterings12 during the call to be eligible.

Don't know whether charts are suitable for you? Take a look at this article at the beginning of this issue of Smatterings.

(Reasonable terms and conditions apply. Just ask us for details.)

If you know someone else who might benefit from this offer or anything else in Smatterings, please feel free to pass on the information to them. Or give us the necessary details here and we'll send them a link for you.


PS: Don't forget about our Gamble-Free Guarantee. We guarantee to save you money overall – if we don't then we will refund the difference. We won't take something on unless it's worth your while, which means you really can't lose!

scroll to top - icon